
 Complaint

| Connector advantages | |
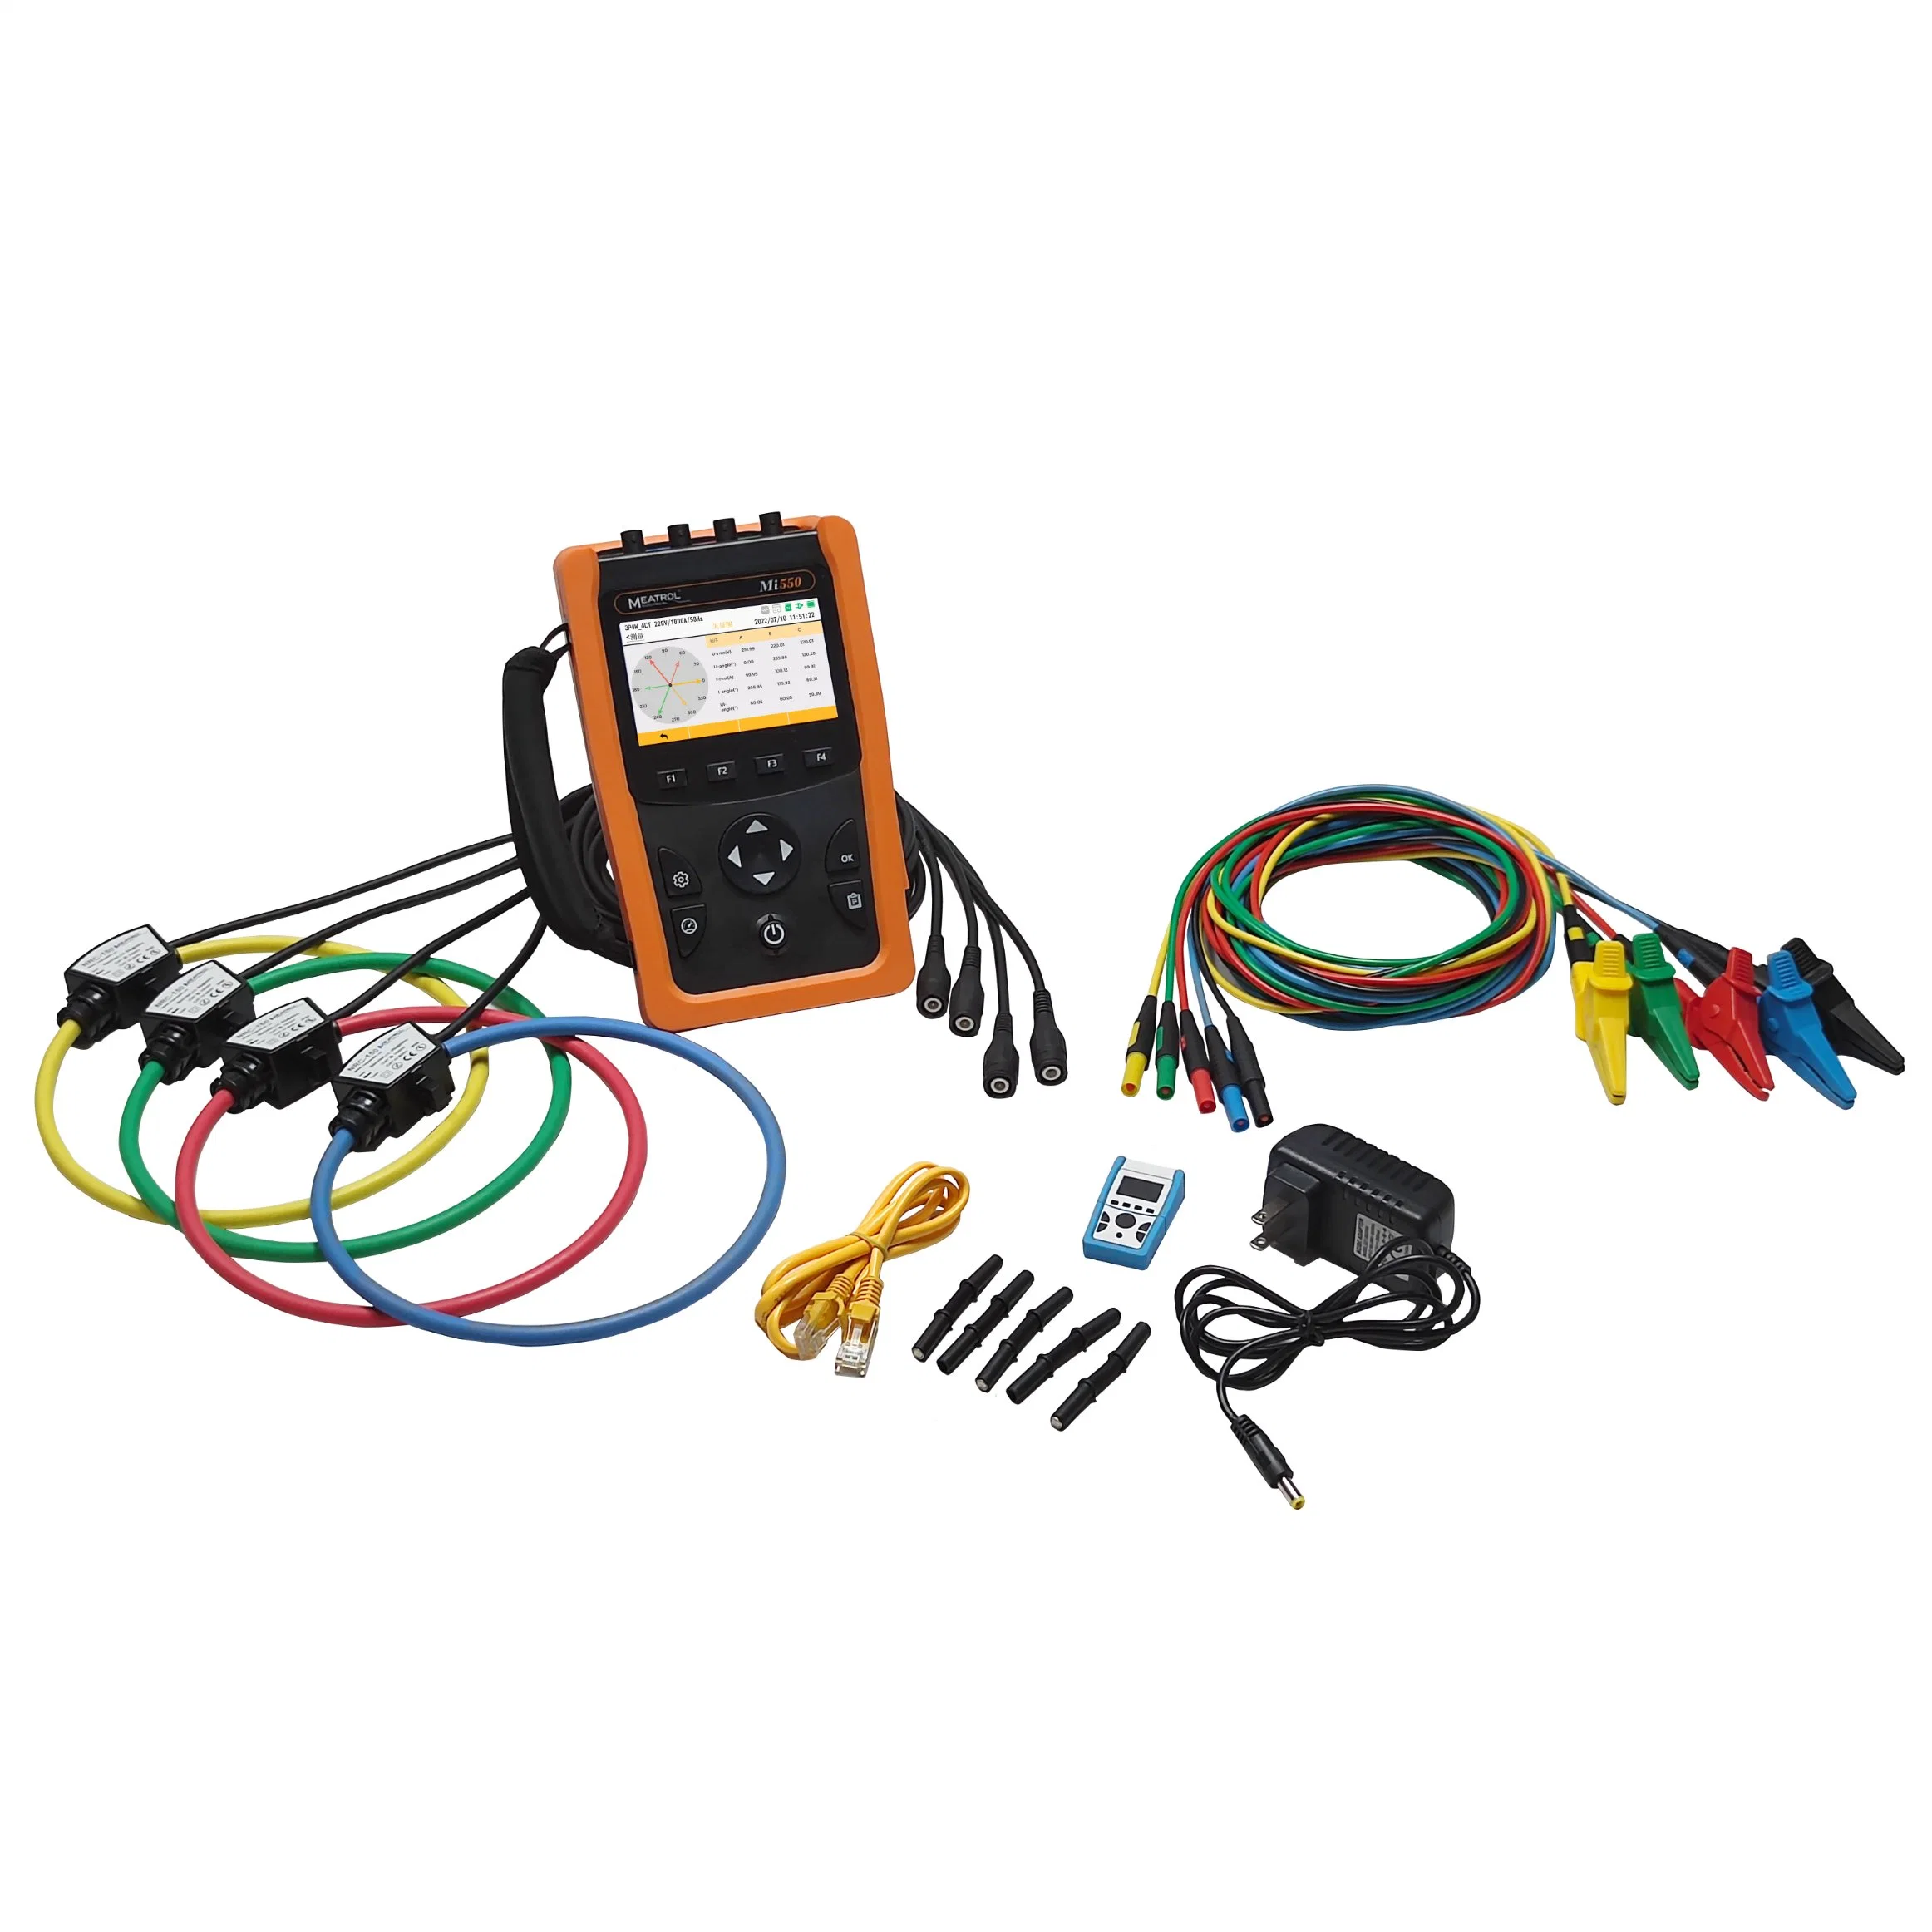
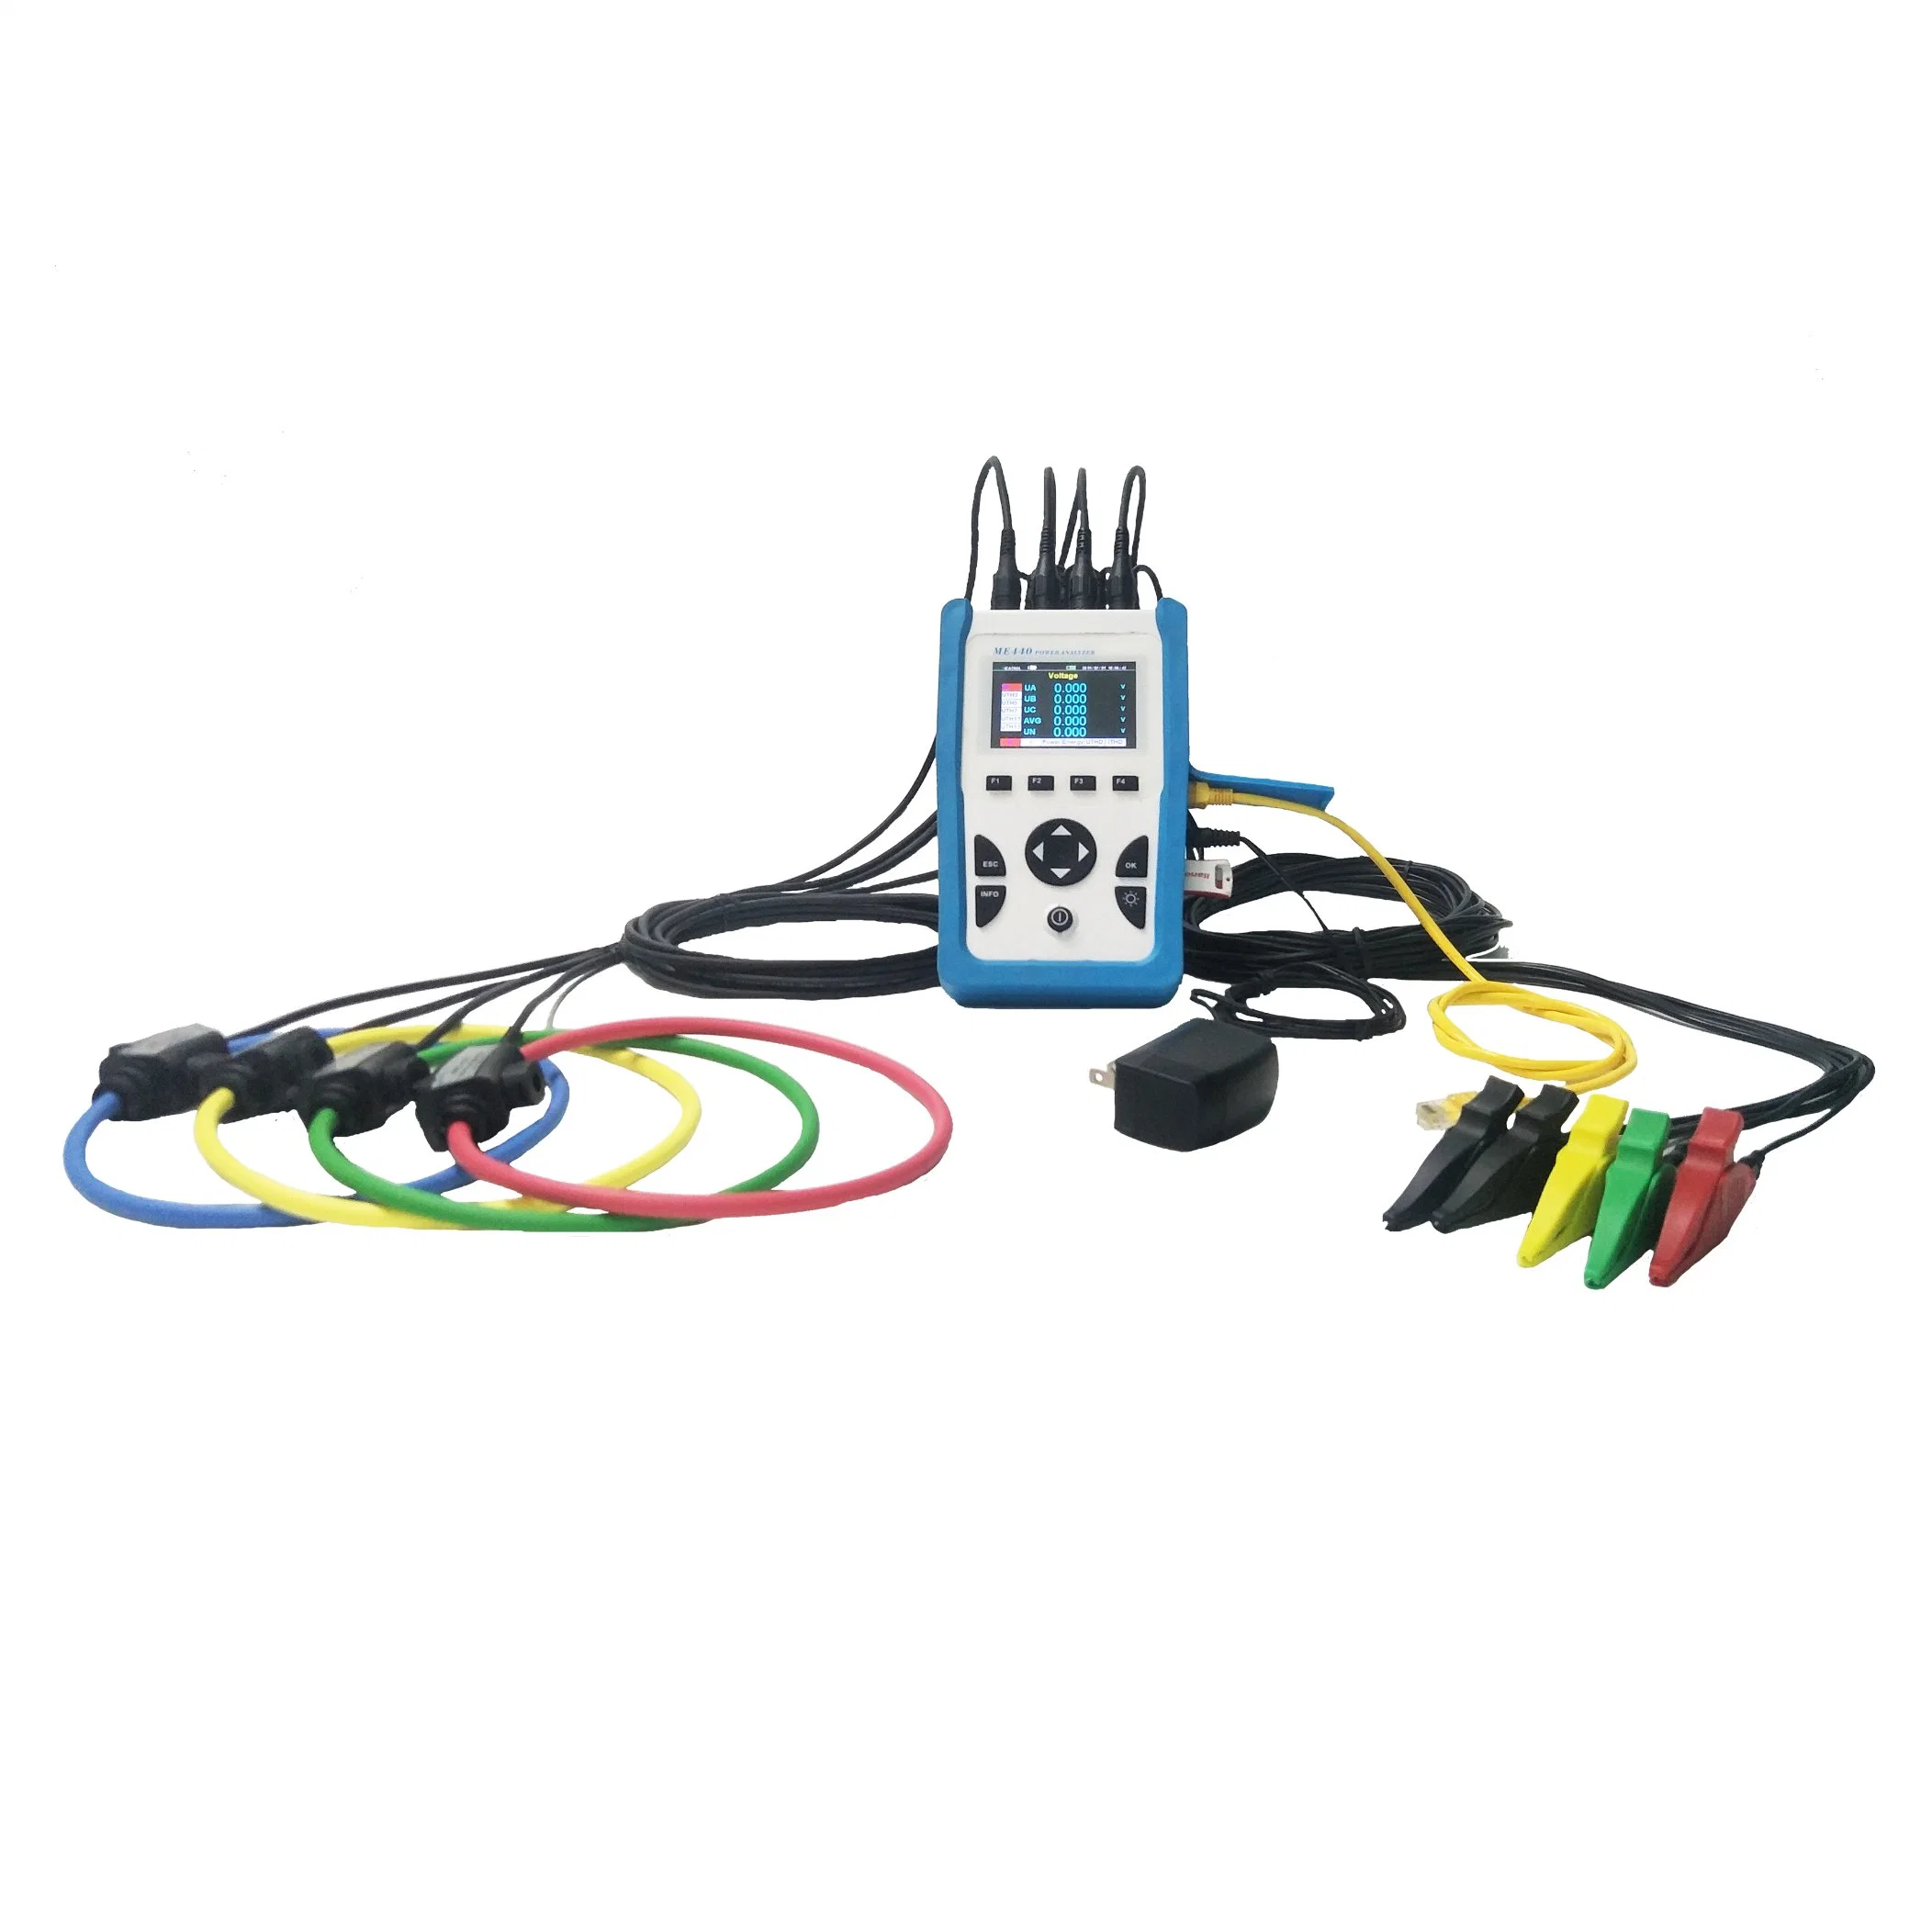
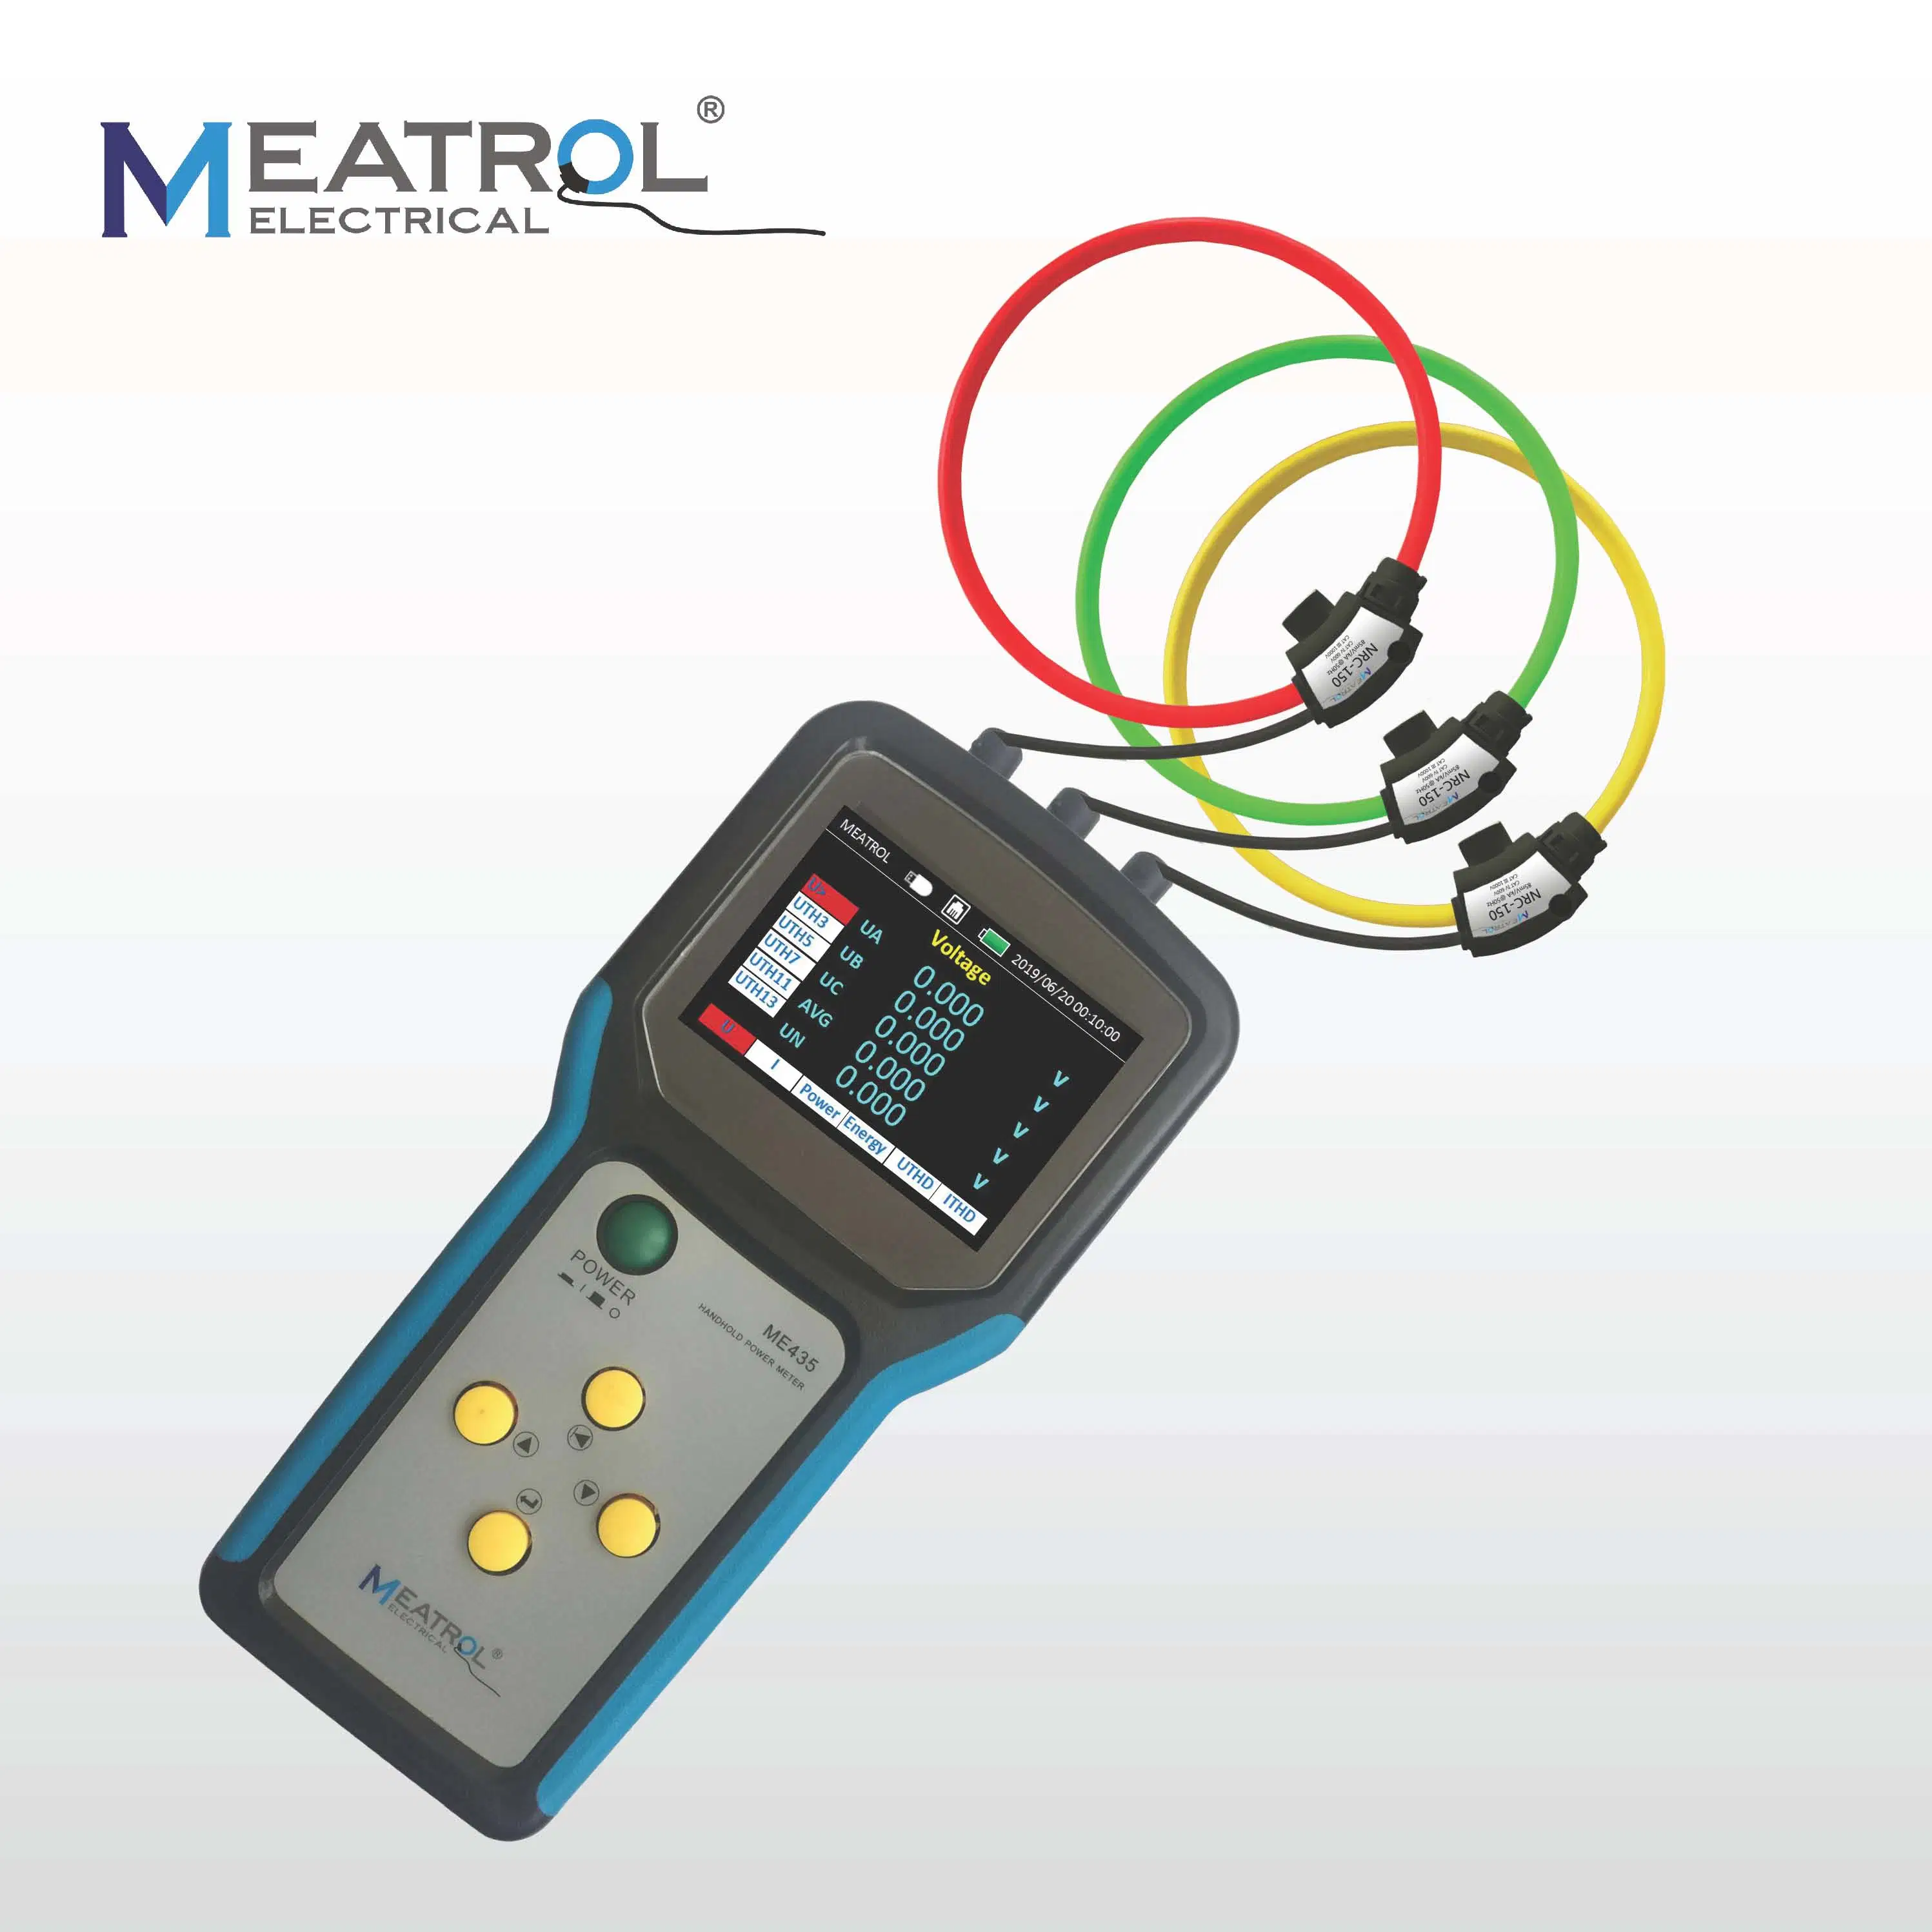
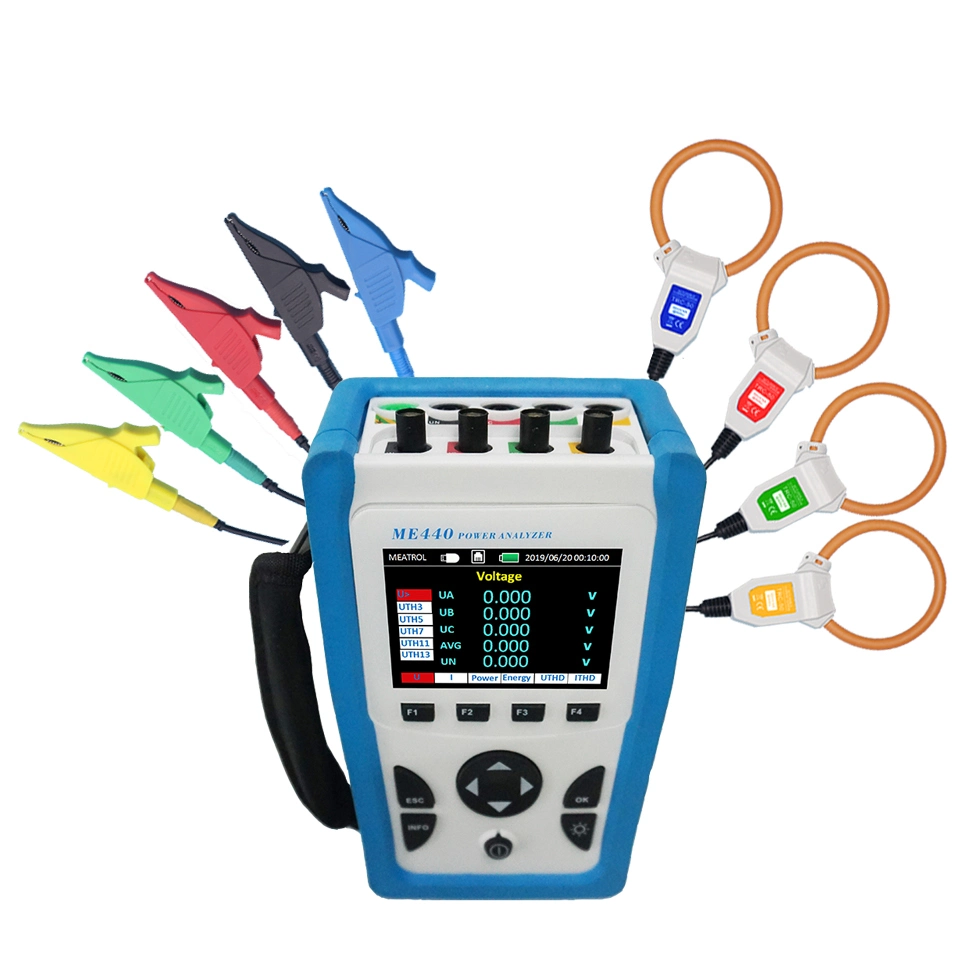
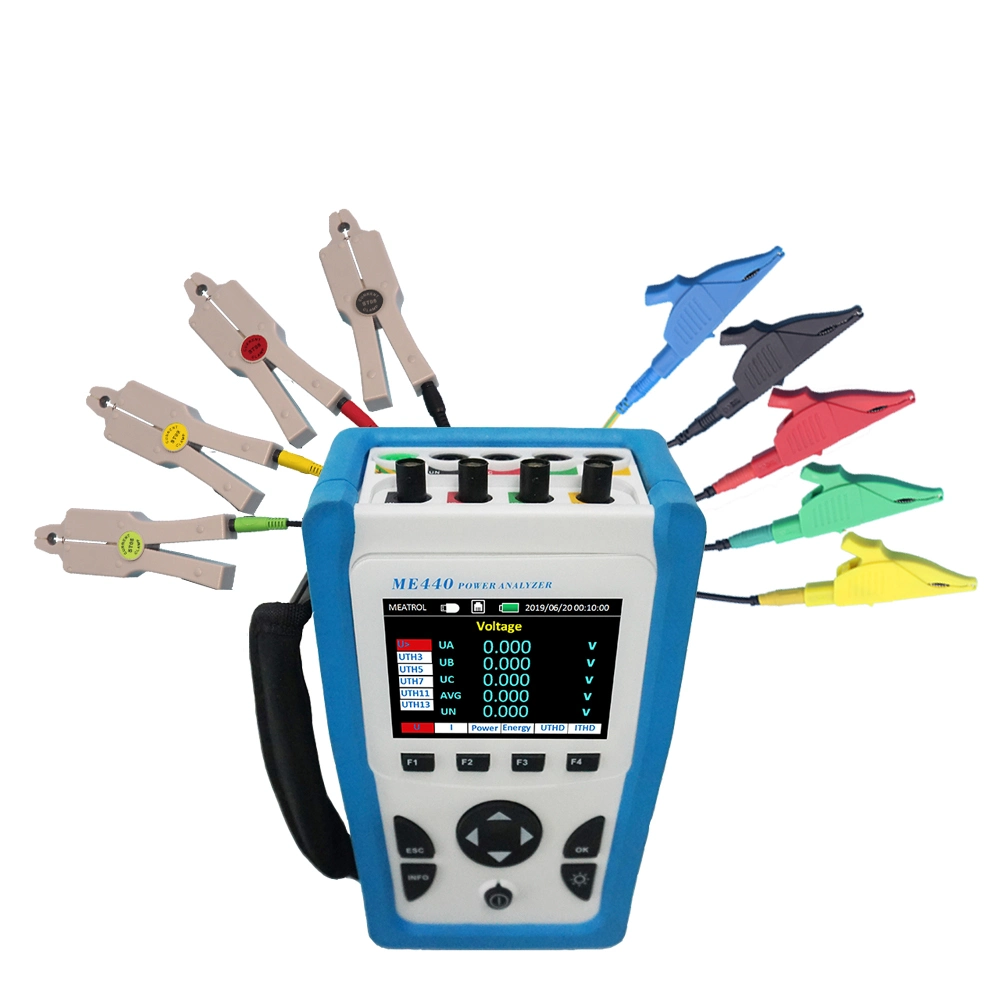
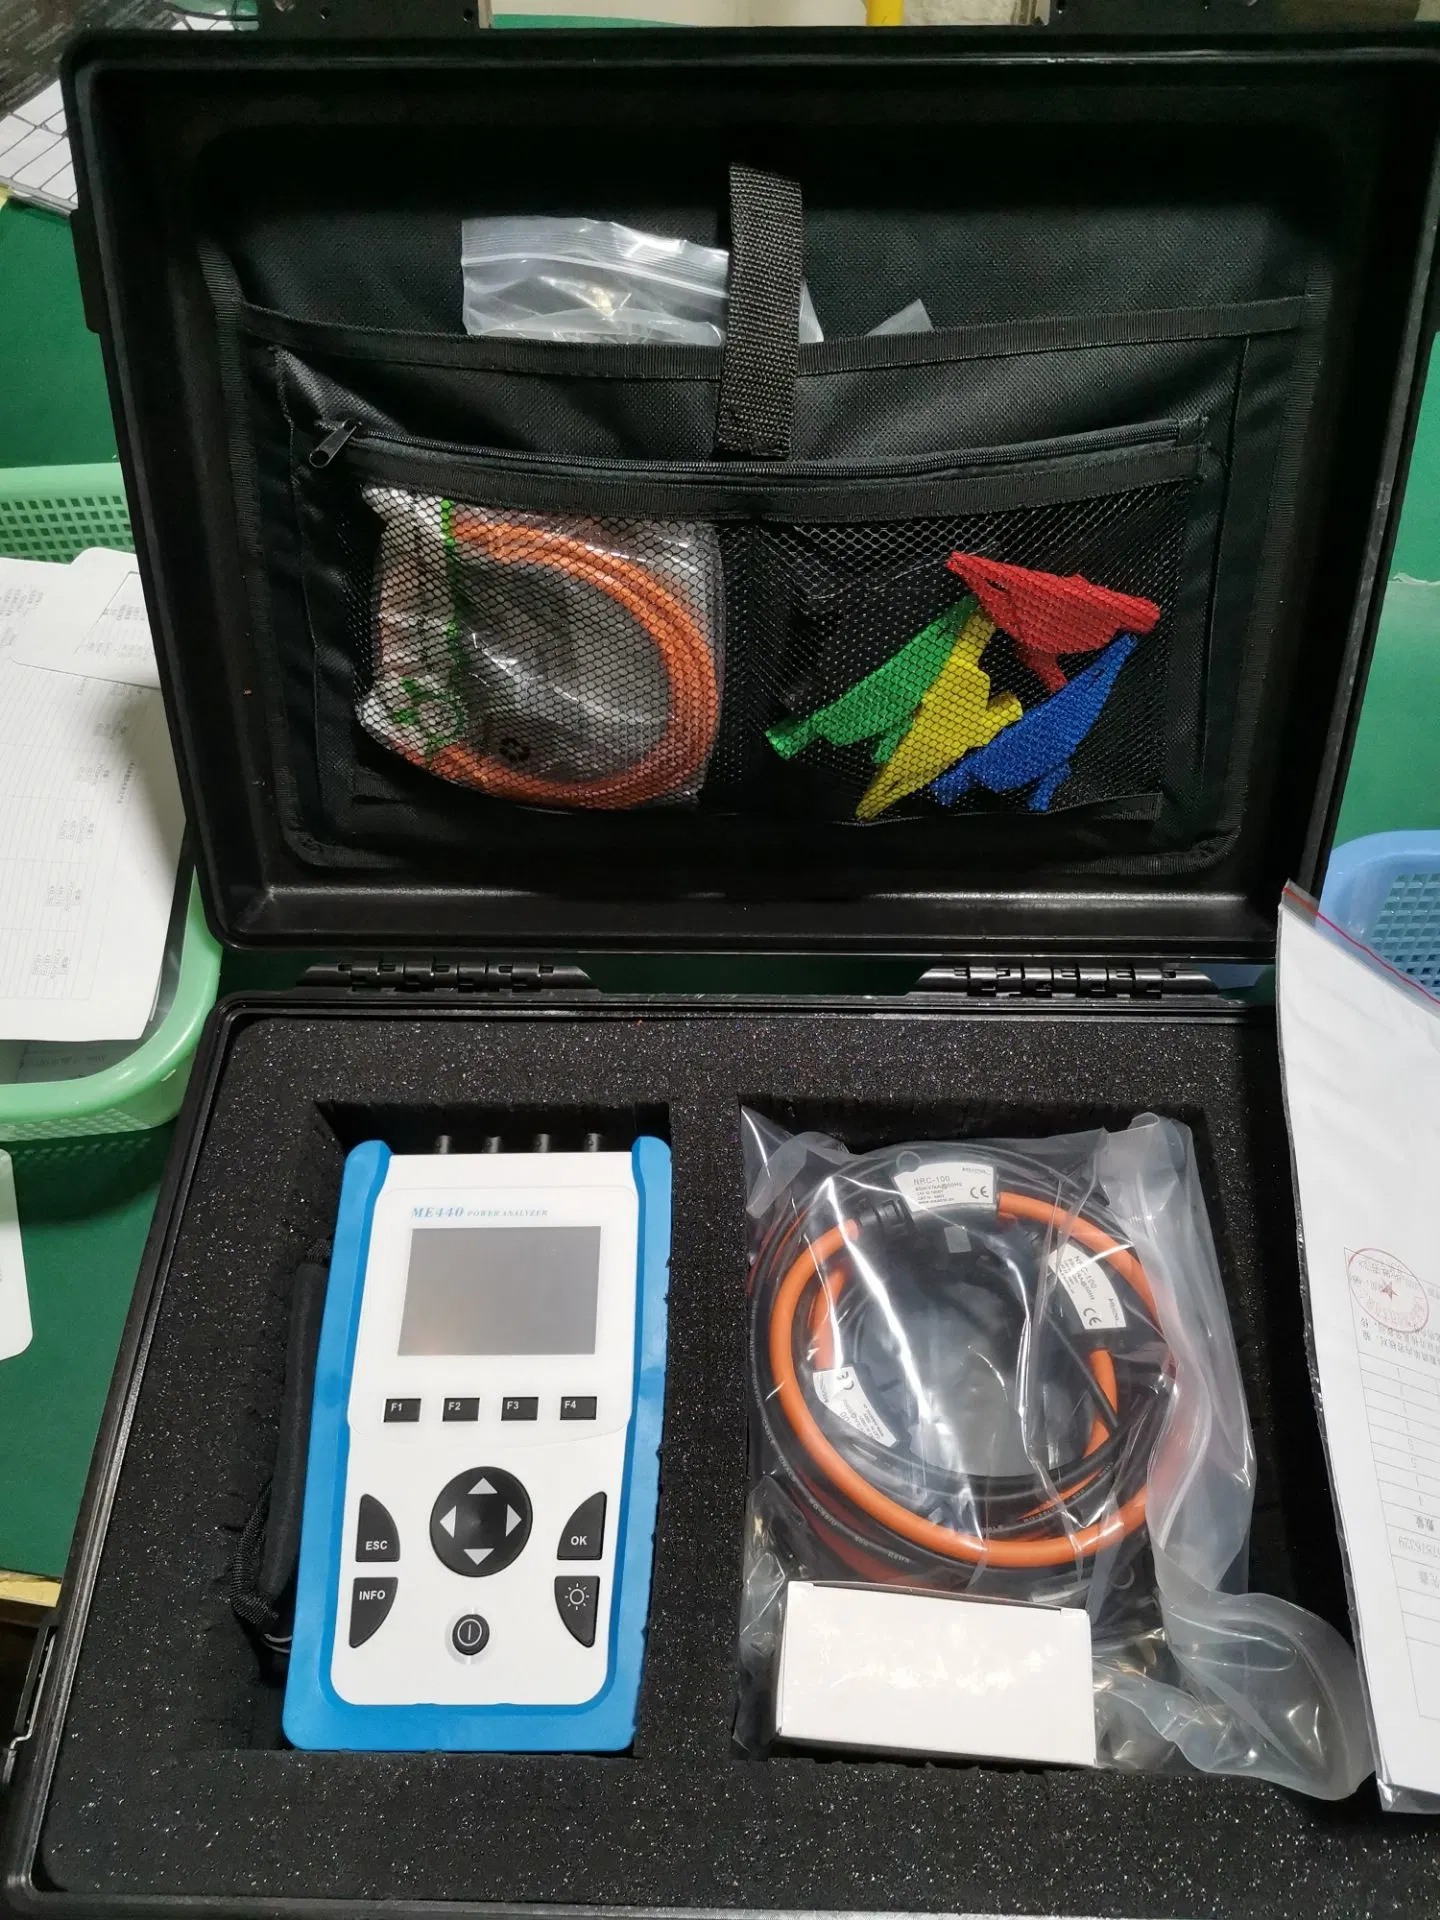
| Model | ME440 |
| Support Extra sensor | 4pcs BNC terminal 333mV CT 4pcs BNC terminal 320mV current clamp 4pcs BNC terminal Rogowski coil |
| Storage | 16GB Memory,USB DISK download (save intervals 1mins default) |
| Power | 2*18650 lithium battery(wroking time: approx 10 hours) Or 5V DC power supply(included adaptor) |
| Specification | |
| Model | ME440 |
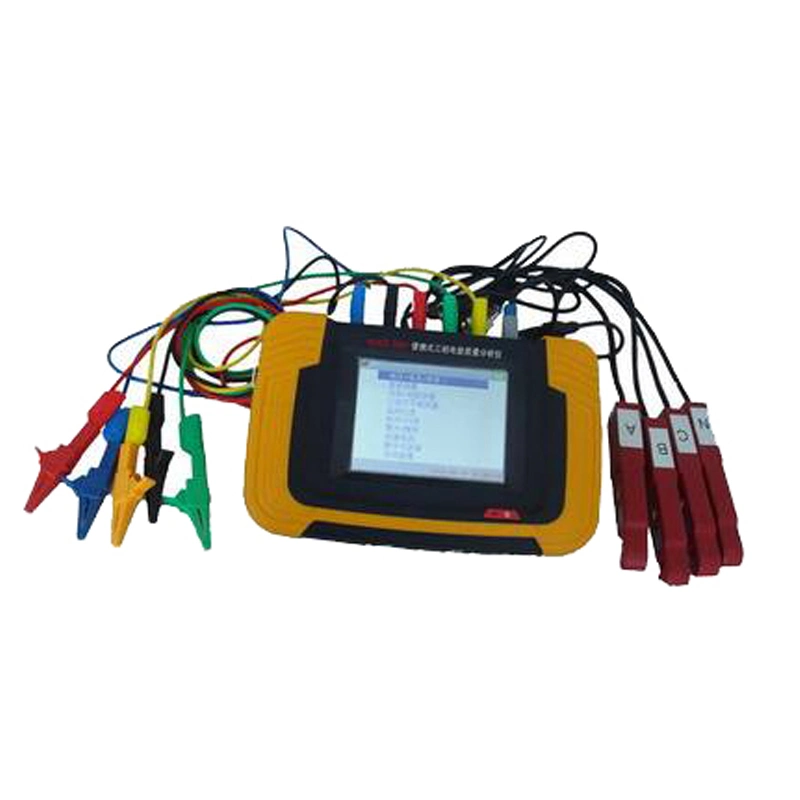
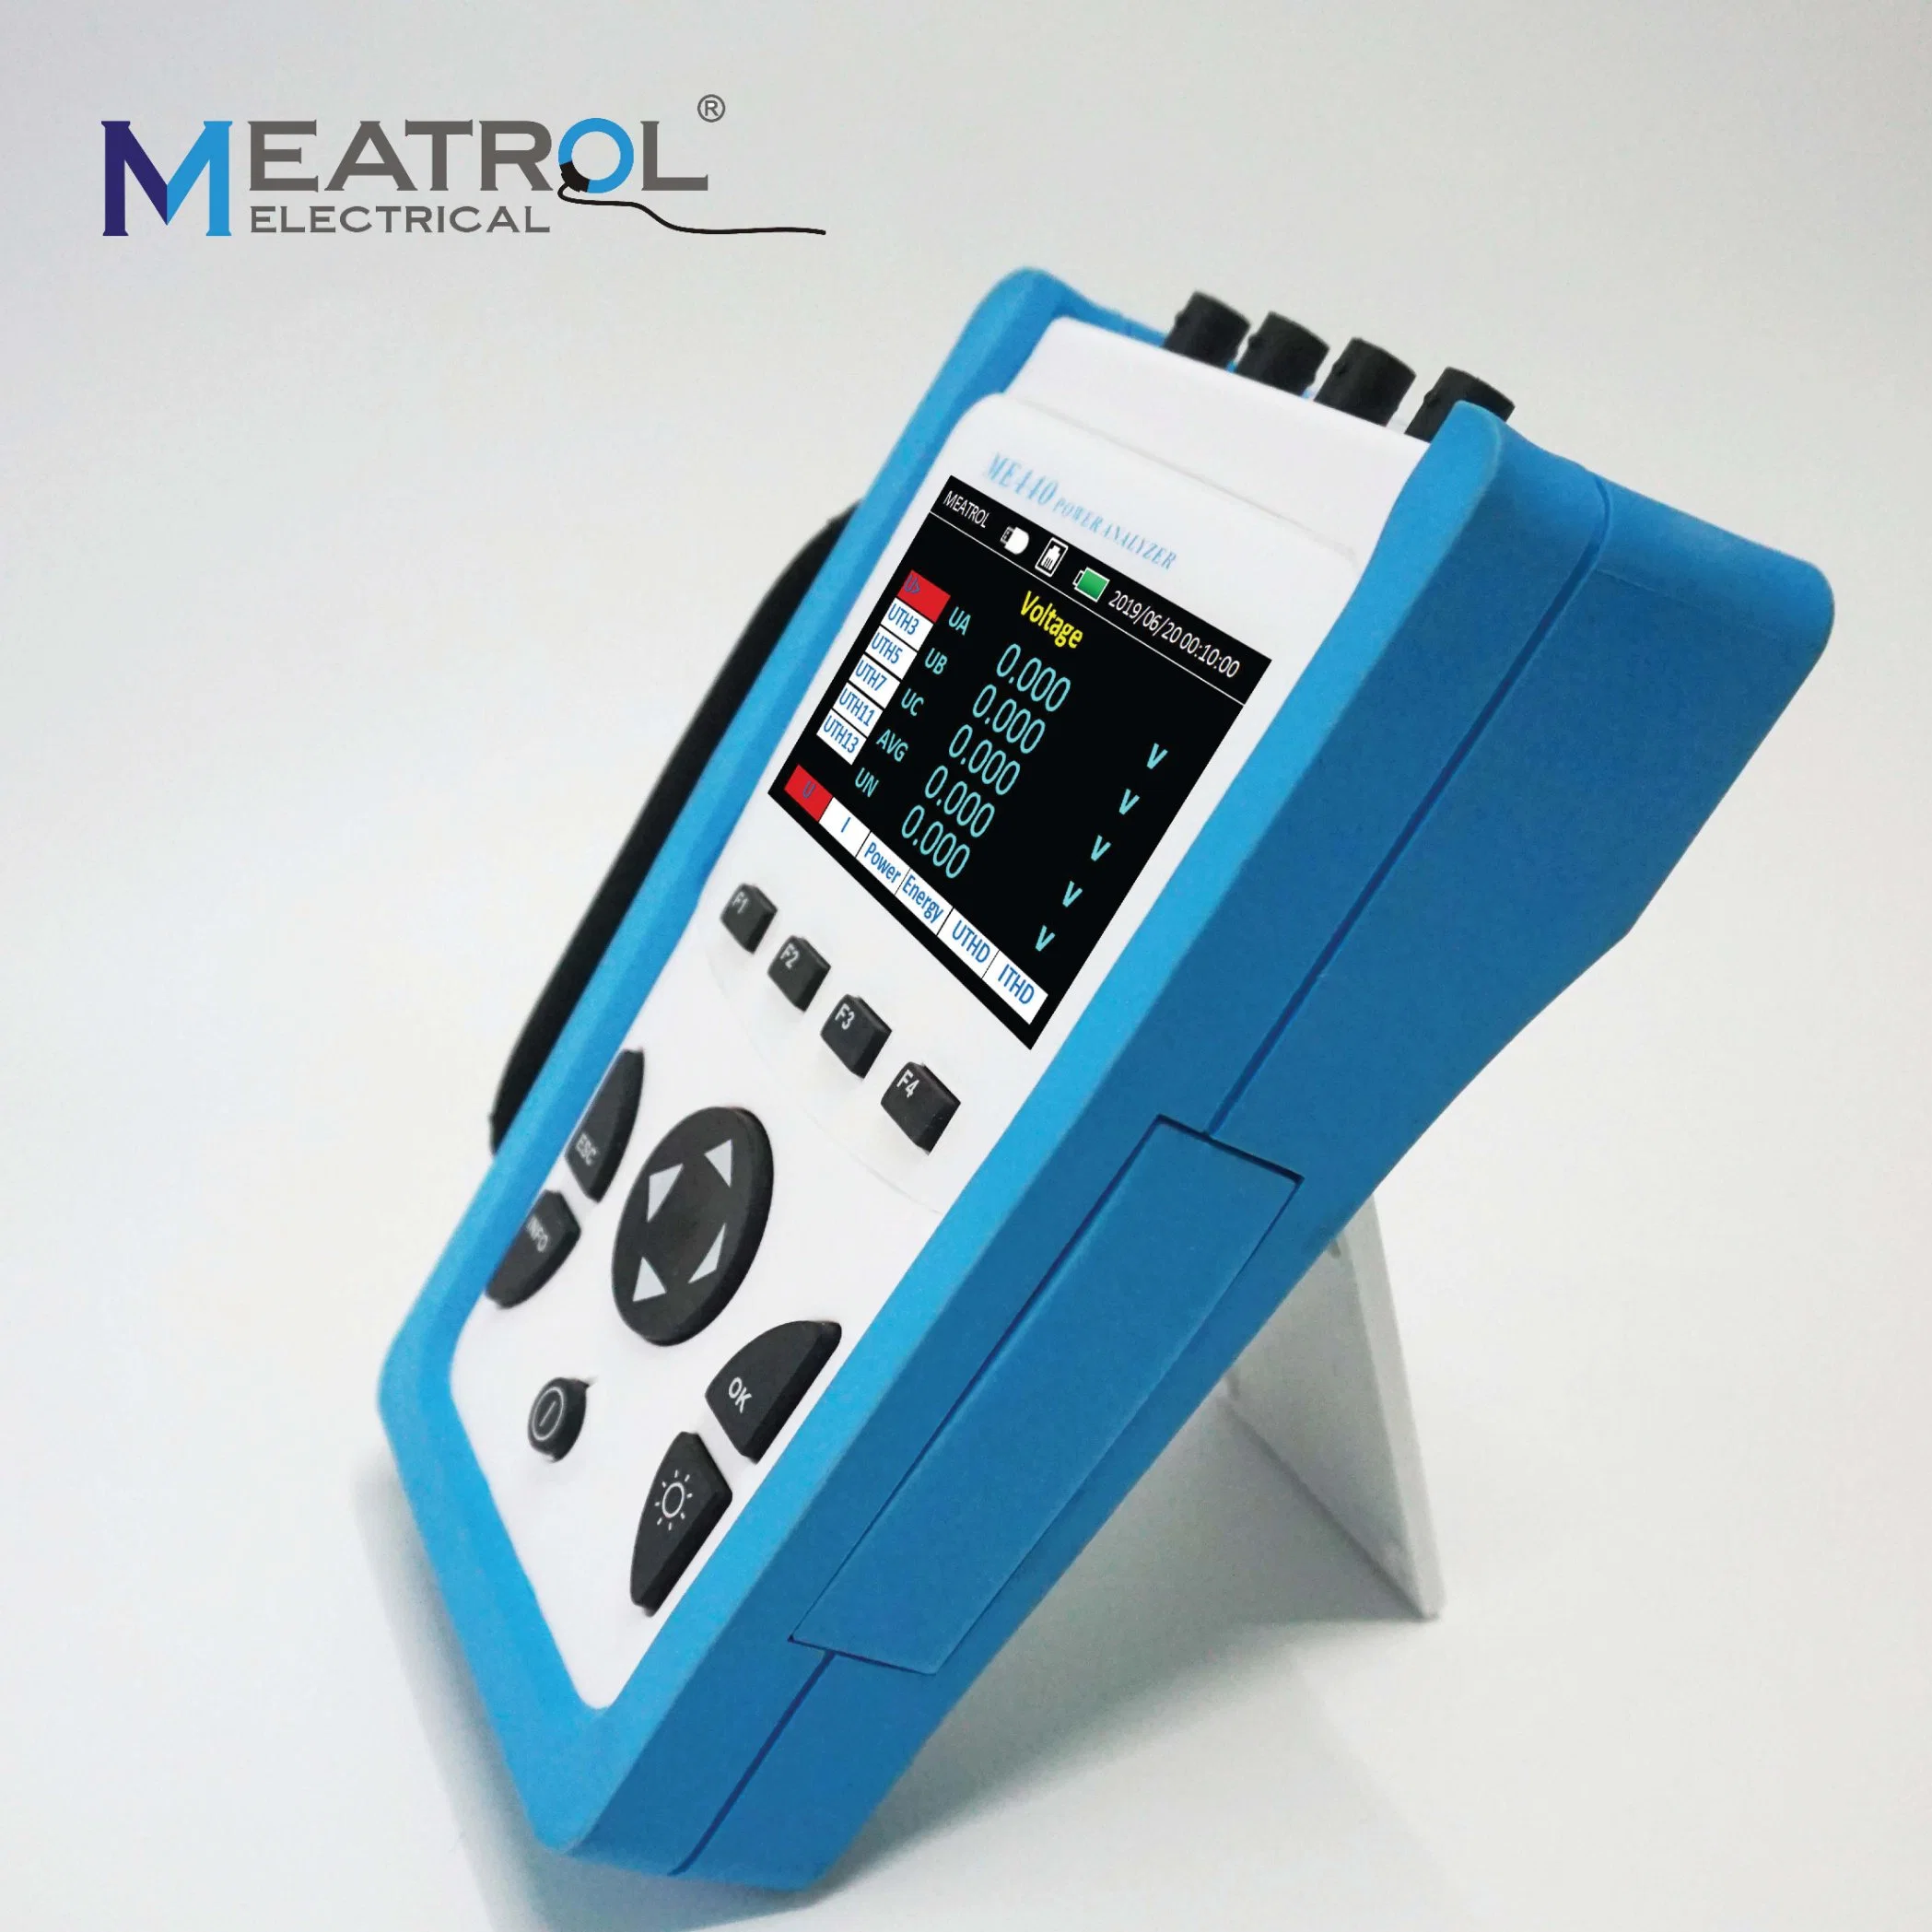
| Product component type | Handheld;poly-phase;data logger;power analyzer |
| Poles description | 3PH4W 3PH3W 1PH2W (L-N); 1PH2W(L-L);1PH3W(L-L-N) |
| Device application | Power analysis Data log |
| Input type | External Rogowski coil External CT(333mV only) |
| Display | 3.5 inch TFT screen display |
| Sampling rate | 8k samples per second |
| Harmonic | 51th in the mean time |
| Mechanical characteristics | |
| Weight | 850g (with Accessory 2kgs) |
| Dimension | L*W*D:21.5*13*6CM |
| Characteristics | Description |
| Current | Per phase, neutral, and average of 3 phases |
| Voltage | L-L, L-N, and average of 3 phases,N-PE |
| Frequency | 45...65 Hz |
| Active power | Total and per phase (signed) |
| Reactive power | Total and per phase (signed) |
| Apparent power | Total and per phase(signed) |
| Power factor (True) | Total and per phase 0.000 to 1 (signed) |
| Angle | Voltage angle,Current angle |
| Current unbalance | Per phase, most unbalanced of 3 phases |
| Voltage unbalance | most unbalanced of 3 phases |
| Characteristics | Description |
| Current | Per phase and average |
| Voltage | per phase and average |
| Active power | Per phase and total |
| Reactive power | Per phase and total |
| Apparent power | Per phase and total |
| Characteristics | Description |
| Current | Per phase and average |
| Active, reactive, apparent power | Per phase and Total |
| Peak Demand Values | |
| Current | Per phase and average |
| Active, reactive, apparent power | Per phase and Total |
| Characteristics | Description |
| Energy values | |
| Active energy | 0 to 999.9GWh Auto reset to 0 in case of over limit |
| Reactive energy | 0 to 999.9GVARh Auto reset to 0 in case of over limit |
| Apparent energy | 0 to 999.9GVAh Auto reset to 0 in case of over limit |
| Characteristics | Description |
| THD | Total,2,3,4,5,,,,,51(51 times) Per phase current (percentage value) X,Y,Z,A,B(5 times each time) Per phase current(rms value) Total,2,3,4,5,,,51(51 times)Per phase voltage(percentage value) X,Y,Z,A,B(5 times each time)Per phase voltage(rms value) |
| Record | ||
| Record interval | 1s to 9999s(default 1min) | |
| Record format | csv | |
| Record capacity | 16GB Memory | |
| Store about 2.5K Bytes data each time | ||
| record 12 years (1min interval) | ||
| Record data | "Current Harmonic"file | ITHD(%),IHD2(%),IHD3(%),,,,,IHD51(%) (Each phase ) |
| "Voltage Harmonic"file | UTHD(%),UHD2(%),UHD3(%),,,,,UHD51(%)(Each phase) | |
| "DataSheet" file | Voltage(V);UTHD(%);Current(A);ITHD(%); Frequency(Hz);Power Factor; Current Demand(A); Current Peak Demand(A)&Date; (Each phase and Average) | |
| Active Power(W) ;Reactive Power(Var);Apparent Power(Va) Active Energy(Wh);Reactive Energy(Varh);Apparent Energy(Vah) (Each phase and Summary) | ||
| Total Active Power Deamnd(W) Total Active Power Peak Deamnd(W)&Date Total Reactive Power Deamnd(Var) Total Reactive Power Peak Deamnd(Var)&Date Total Apparent Power Deamnd(Va) Total Apparent Power Peak Deamnd(Va)&Date | ||
| Characteristics | Description |
| Reset | |
| Minimum and maximum values | - |
| Peak demand values | - |
| Current demand calculation method | 1 to 60 minutes |
| Power demand calculation method | 1 to 60 minutes |
| Environmental conditions | ||
| Operating temperature | -25ºC to +55ºC | |
| Storage temperature | -40ºC to +85ºC | |
| Humidity rating | 5 to 95% RH at 50ºC(non-condensing) | |
| Pullution degree | 2 | |
| Overvoltage category | III,for distribution systems up to 277/480VAC | |
| Dielectric withstand | As per IEC61010-1, Doubled insulated front panel display | |
| Altitude | 3000m Max | |
| IP degree of protection | IP20 conforming to IEC 60629 | |
| Colour | White | |
| Contractual warranty | 12months | |
| EMC | ||
| Electrostatic discharge | Level IV(IEC61000-4-2) | |
| Immunity to radiated fields | Level III (IEC61000-4-3) | |
| Immunity to fast transients | Level IV (IEC61000-4-4) | |
| Immunity to surge | Level IV (IEC61000-4-5) | |
| Conducted immunity | Level III (IEC61000-4-6) | |
| Immunity to power frequency magnetic fields | 0.5mT (IEC61000-4-8) | |
| Conducted and radiated emissions | Class B (EN55022 ) | |
| Standard compliance | ||
| EN 62052-11,EN61557-12,EN 62053-21,EN 62053-22,EN 62053-23,EN 50470-1,EN 50470-3, EN 61010-1,EN 61010-2,EN 61010-031 | ||
| Measurement accuracy | ||
| Rated current (3 level selectable) | 600A(0.5% from 6A to 720A) 3000A(0.5% from 10A to 3600A) 6000A(0.5% from 20A to 7200A) | |
| Rogwoski coil connect setting | 600A | TRC-36 |
| 3000A | NRC-150 or Y-FCT-510 | |
| 6000A | NRC-200 or Y-FCT-800 | |
| ST08 current clamp | 5A | 0.5% (100mA~5A) 1%(10mA~100mA) |
| 10A | 0.5% (100mA~10A) 1%(10mA~100mA) | |
| CTs connect setting | Primary setting: | from 1A to 999999A |
| Secondary setting: | from 0.001mV to 707mV | |
| Voltage | 0.2% from 5 to 600V | |
| Power factor | ±0.005 | |
| Active/Apparent Power | IEC62053-22 Class 0.5 | |
| Reactive power | IEC62053-21 Class 2 | |
| Frequency | 0.01% from 45 to 65Hz | |
| Active energy | IEC62053-22 Class 0.5s | |
| Reactive energy | IEC62053-21 Class 2 | |
| Input-current characteristics | ||
| Primary current range | 600A 0.5A to 720A 3kA 0.5A to 3600A 6kA 0.5A to 7200A | |
| Measurement input range | 1/225mV-707mV | |
| Permissible overload | 2V for 10s/hours | |
| Power Supply | ||
| Power | 2*2900mAh PANASONIC lithium battery Working time: 10 hours Charging time: 8 hours | |
| 5V DC power supply(included adaptor) | ||
| power consumption | ||
| Screen Maximum Brightness | 2000mW | |
| Screen Minimum Brightness | 1800mW | |
| Wire diameter for terminals | ||
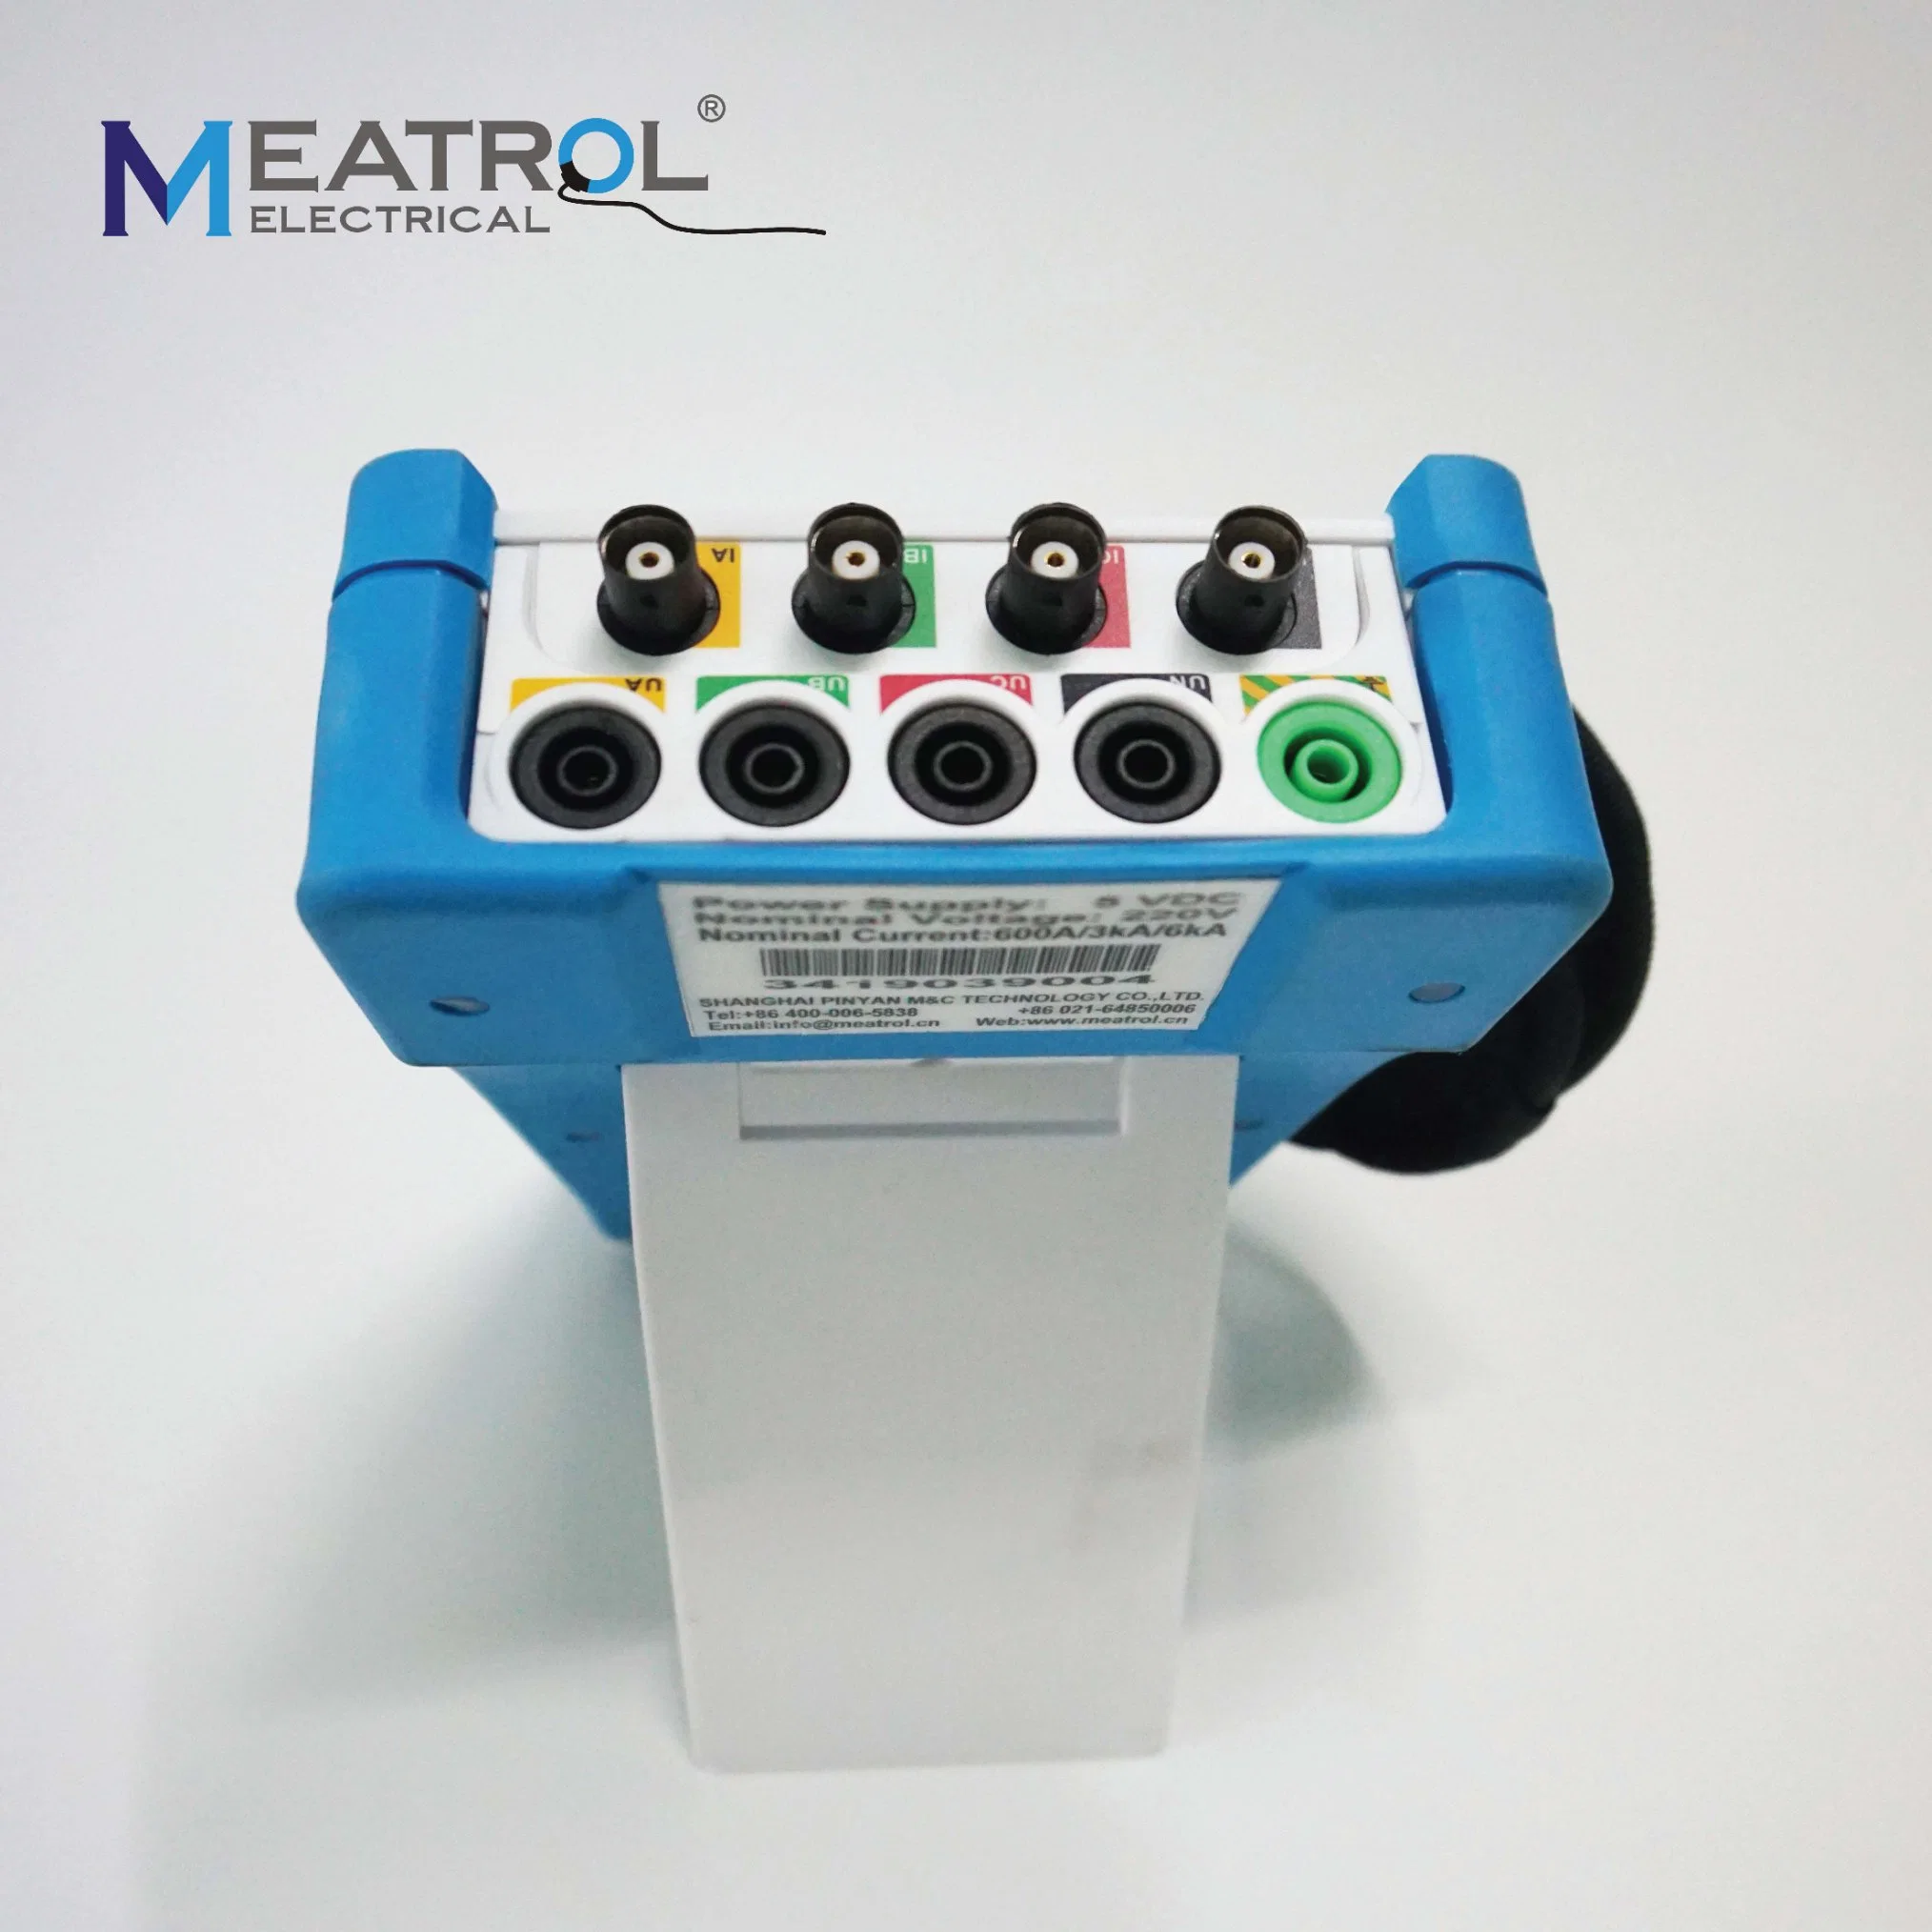
| Current input | BNC connector | |
| Voltage input | Banana plug | |
| DC power supply | DC 5.5*2.1 plug | |
| Communication | |
| Transmission mode | RJ45 port |
| Communication protocol | MODBUS TCP |
| Settings | |
| IP address | Configurable (default 192.168.1.5) |
| Port No. | 502 |
| Port number | Port name | Port function | Remarks |
| 1 | IA | A-phase current input | Current input |
| 2 | IB | B-phase current input | |
| 3 | IC | C-phase current input | |
| 4 | In | N-phase current input | |
| 5 | UN | N-phase voltage input | Voltage input |
| 6 | UC | C-phase voltage input | |
| 7 | UB | B-phase voltage input | |
| 8 | UA | A-phase voltage input | |
| 9 | UE | PE-N voltage input | |
| 10 | Power | POWER 5V DC | Power 5-9V DC |
| 11 | USB port | Download log data | Plug out(in) USB DISK |
| 12 | RJ45 port | Mobus-TCP communication | Communication |
| Accessories | |
| Voltage wires | 5pcs voltage clamp wires with banana plug (2 meters,1.5mm²) |
| Adaptor | 85-265 AC to 5V DC adaptor(default Europe plug) |
| Remark | Rogowski coil not included |